Shiny suicide_indicator_r Dashboard
dashboard
data_science
education
shiny
ggplot
Shiny
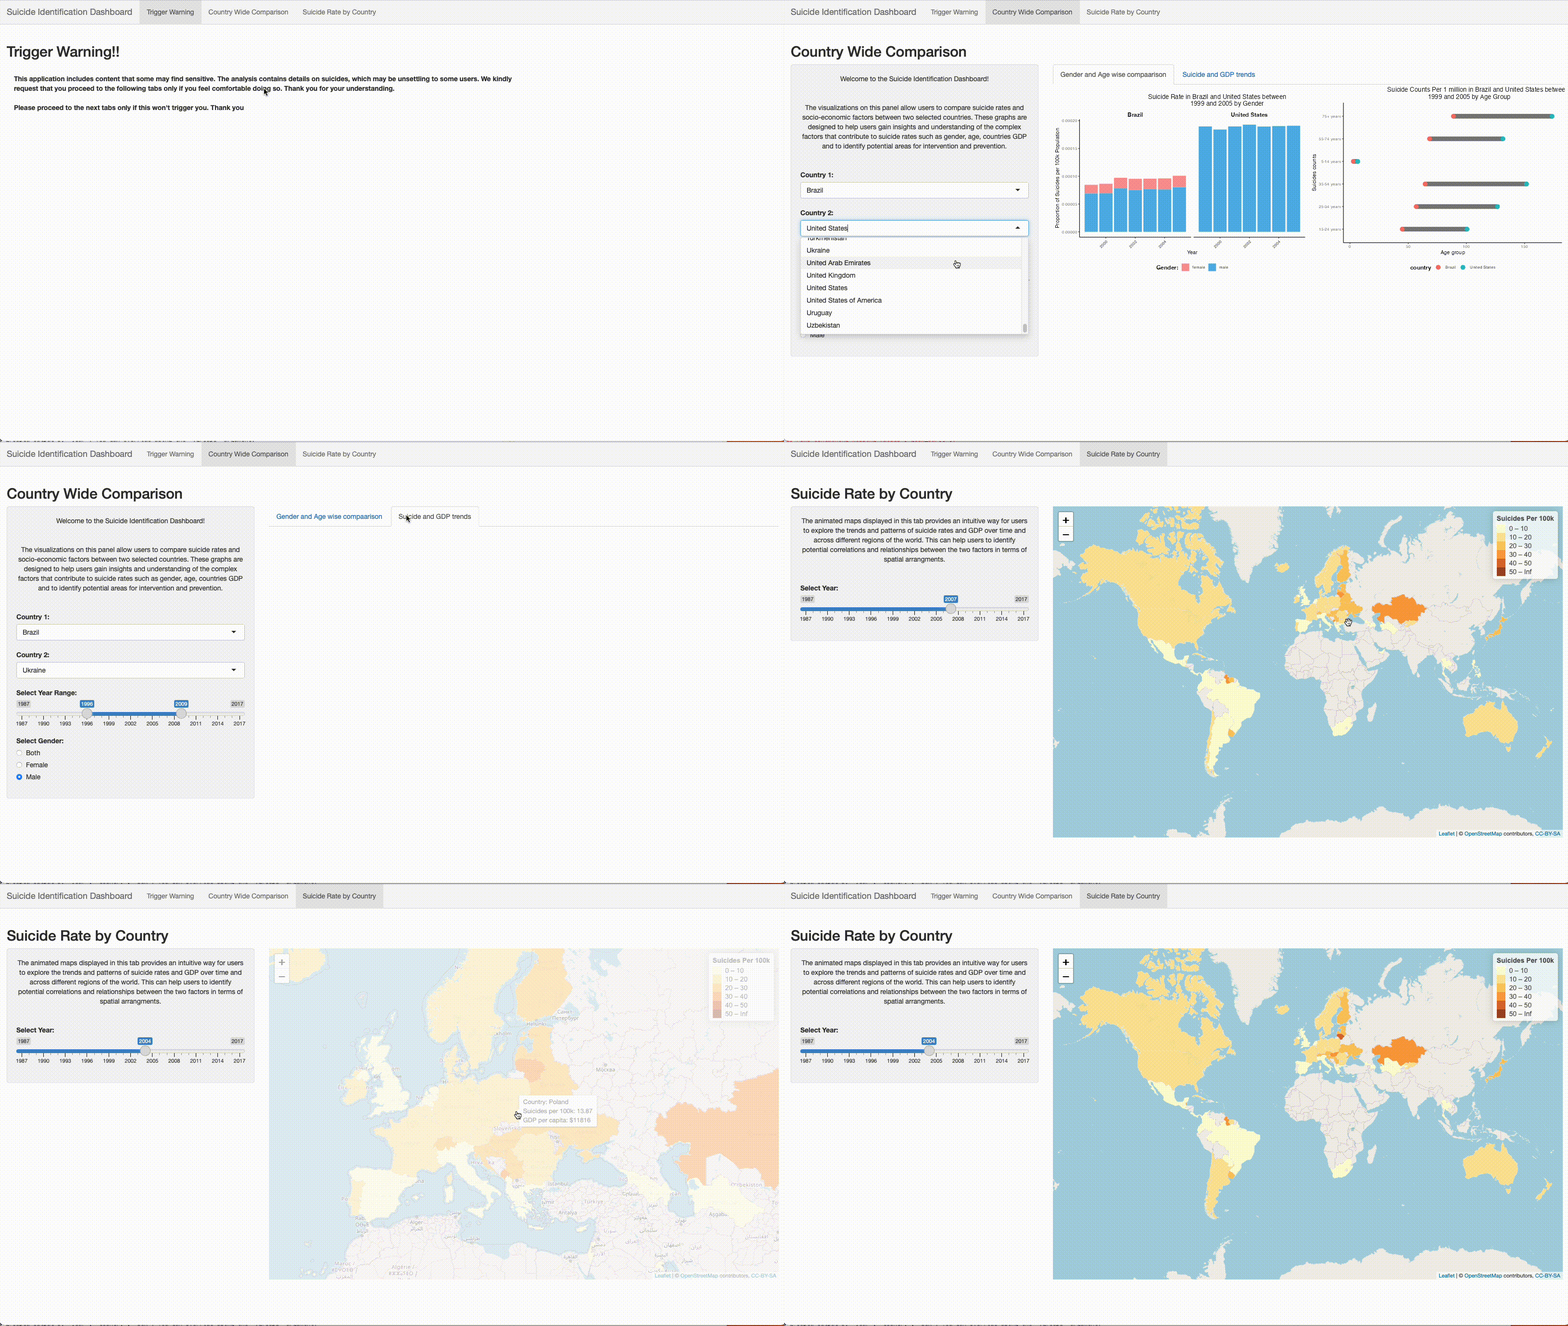
suicide_indicator_r Dashboard analyzes the suicide rates and related socio-economic factors in different regions of the world.
Summary

This app written in Shiny and Dash analyzes suicide rates and socio-economic factors using data from the World Health Organization. It features interactive maps, bar charts, and line plots to visualize the data by country, gender, age group, and time period. The app allows anyone interested in exploring and analyzing suicide rates to study the trends in order to find measures to mitigate the detrimental effects of such phenomena.